Monday, October 30, 2023

Pascagoula, Mississippi, Land Use and Land Cover Classification

 Hello and Welcome,

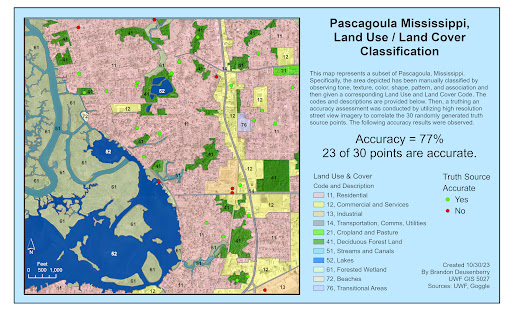
This week covered two interrelated topics. Land use and land cover, and assessing accuracy or truthing for the same. The combined result of which is displayed below. So what happened? 

First, with only an image of the Pascagoula area of Mississippi, and a basic understanding of Land Use and Land Cover classification, I digitized the entire image area according to my visual inspection of the land use or cover elements present. Utilizing the tone, texture, shape, size, color, patterns, and associated elements that we discussed last week, I went through and identified the uses of these areas and then gave them the corresponding code, down to the 2nd level of classification. for example, I identified residential areas, but did not sub divide into single unit or multi-unit dwellings. Or, as another, streams and canals were identified, but not specifically, rivers, creeks, rivulets, manmade or natural, etc. 

Then, after the entire image was classified according to my visual inspection, I utilized a random point generator to create markers for truthing. Because I could not physically go to Pascagoula and these sites, I utilized Google Street View, in place of an in situ investigation. The sample size was kept at an easily manageable level, only 30 points for training purposes, despite Jensen suggesting a minimum of 50. But for training purposes this allowed me to break out a couple of good datapoints. 

There was an overall accuracy of 77% as depicted below, just based on the points used. But some categories like the residential category show in excess of 89% accuracy sense more points were in that category and they appeared to be relatively more accurate. But at the same time, with the random sampling technique, not all categories were included. That is one area for improvement for future truthing, ensuring all categories are sampled. 


Above you can see the different usage and cover categories that make up the picture, as well as the truthing points. With more time, we would see a continued expanding of the Land Use / Cover Cateogries, but more specifically, further subdividing into 3rd level categories which would provide a larger nuance to the classification presented here. 

Thank you.

v/r

Brandon


Tuesday, October 24, 2023

Visual Interpretation - An Imagery Orientation

 Welcome to the first lab of the Aerial Photo and Remote Sensing course. This lab was a combination of 3 interrelated exercises. The first two were variations on a theme, how do you analyze and interpret features within an image. 

Utilizing visual tones and textures, we first identify areas that help provide visual contrast throughout the scene. That is the subject of the first map below. This map Utilizes an objective scale for tones transitioning from very dark, dark, medium, light, very light, and then textures from very course, course, mottled, smooth, very smooth. These were done by creating a new feature class and then manually digitizing the polygon containers for the specific features. I also personally feel the harder of the two to prescribe a clean break in scale is Tone. Especially when the entirety of the image is gray scale or panchromatic. 


This next graphic is very similar to the one above, but it focuses on visual characteristics broken down into four specific categories to help provide positive feature identification. The categories are shape/size, shadow, patterns, and local association. Examples for each category highlighted below include applying point features to obvious beach buildings based on their rectangular shape. The central water tower is more easily recognized because of the shadow it casts. Likewise, power poles and power lines all cast definitive shadows based on an illumination source to the south, southeast of the scene. For localized patterns the beach neighborhoods, parking lots, and roadways all provide definitive features based on this characteristic. Association is one of the more nuanced concepts, as it relies upon the relationship of surrounding objects or scene. For example, a long rectangular thoroughfare jutting into the water… really can only be a Pier in this context. Also, there are a couple of dark blotches surrounded by buildings or other features serving to highlight this central area. These are swimming pools in a courtyard.  


The third portion of the lab was a comparison between a True Color and False Color version of the same image.  This exercise was overall less involved in the technical aspects, as it focused on comparing two map frames, one True Color, one False Color, with 5 common reference points described above. The same technical skills as above were applied. Adding undefined imagery, and creating a new feature class, and then locating comparison points.

As an introduction to the differences between True and False color, this exercise served to highlight some broad differences in presentation with simple color band assignment changes. The water, forests, and certain man-made features provided the greatest contrast, often with the False Color causing the features to be more discernible.

The direct side by side of the images is below.


Thank you for your time, look forward to seeing you next lab!

v/r

Brandon

Tuesday, October 17, 2023

Starting GIS 5027 - Remote Sensing

 Greetings and hello,

Let's follow on from the successful completion of  Intro to GIS and continue this journey with the Aerial Photo & Remote Sensing course. The amount of technical knowledge and increased understanding provided by this course is an excellent accompaniment to my career working as a remote sensing operator. Or more colloquially known as a Sensor Operator within the Air Force. Thanks for coming along with me.

v/r

Brandon

Saturday, October 14, 2023

GIS 5050 Final Project - Bobwhite Manatee Transmission Line

 Welcome to the culminating event of the class, the final project. This was certainly a lot of work in a short period of time. The primary subject of the final was an analysis of the Bobwhite - Manatee Transmission Line which was a Florida Power and Light initiative to bridge Manatee and Sarasota counties power needs with a new 230Kv transmission line. Before I get too indepth with the project or its deliverables, I will highlight that I have a 32 minute long presentation linked below. Additionally, the presentation and slide by slide narrative are all available right here. Then we will discuss some key areas below. 

Final Project Video Presentation

Final Project Presentation PDF

Final Project Slide Commentary

The overarching purpose of this project was to perform a suitability analysis on this already complete project. It was started in 2006, and completed sometime in 2022, or so my sources show. but, using GIS principles and skills, can we validate and or recreate some of the forethought analyses that went into this project to determine if it meets the following criteria: minimal impacts on homes and homeowners, minimal school impacts, avoids negative impacts for parcel owners, and conservation areas, and is the overall line length affordable? 

To answer these, several different analyses were performed. Each of which generated some map elements that feed the presentation linked above. 

Lets first take a look at the base map. 


The primary highlight here is that we are looking at Manatee and Sarasota Counties in Florida, and have several different looks at the Preferred Corridor outlined in red, which is within an overall project study area, the rectangle in blue. 

Next let's look at each of our objective criteria: conservation lands interaction, homes, schools, parcel impacts, and then the overall length.


The key here was defining the intersection between the conservation areas and the preferred corridor. And also breaking down the whole of the corridor into wet and dry land. All of these were then taken into account as they defined the environmental impacts to this region. 

Changing gears and toolsets we will look at the impacts on homes. 


This process involved utilizing the reference imagery to populate a feature class shell with home locations across the preferred corridor. This map also introduces a 400-foot buffer around the preferred corridor, which was used to identify homes inside the corridor, and those still in close proximity but outside. 

Following this I looked at parcel interactions with the preferred corridor.


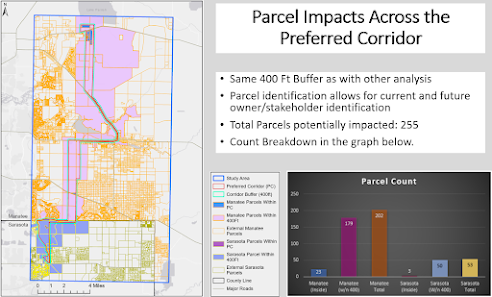
This map and graphic breaks down parcels that are completely contained by the preferred corridor, and those that merely intersect it. Utilizing the select by location feature and defining that within vs connecting relationship allows us to identify all of the impacted parcels so that a more accurate list of stakeholders can be generated. 

Next we had to look at school considerations. 


This is my least favorite aesthetically. It is a very simplistic overview of school clusters across the counties. Only 5 of which are located within the study area, and none of which are in the preferred corridor. This would suggest there is negligible school impacts. However, despite that, this was one of the most involved processes to generate this map view. 

Specifically, the school data have to be obtained from the Florida Department of Education, then converted into a useable tabular format. Separately, line information for the counties was acquired and put into an address locator. This locator when married with the tabular school data created a geocoded schools layer, which is all of the points you see here. 

From there, the final look is at the length of the corridor. 


This one was fairly entertaining to create. Even though its a simpler view than the above, finding ways to transform the polygon-based preferred corridor into a center line, in order to calculate the overall length was interesting. Ultimately we can see that a direct start-to-finish line only covers 18 miles, but the circuitous route that the corridor takes adds several miles. Up to approximately 25. 

Taking all of the images together into account we can paint the picture that the multiple bends, offsets, and adjustments to the line is what really makes it work. While it is a longer path from start to finish this way, it very well does minimize as many impacts as possible. 

For a much more thorough discussion on this process and project, please watch the presentation linked above. Thank you. 


v/r

Brandon
Thursday, October 5, 2023

Georeferencing the UWF Campus

     As with each of the labs in this course, there were multiple different exercises to undertake. They all centered around the UWF main campus outside Pensacola Florida. While previous labs worked toward building data layers, this one focused on taking unreferenced or unregistered raster (imagery) layers and applying point features that could give specific spatial reference for the image. For example, we had a known buildings and roads feature set which were used as the reference layers. And then we took satellite imagery of UWF, and established control points to link the imagery to known features. 

Once the imagery was registered to the reference layer with the control points, new features needed to be added or digitized to the buildings and roads layers. The main frame on the left side of the image below illustrates the combination of two satellite images, which were registered through two different transformation methods, then building 72 and Campus Lane were added and specifically highlighted. Additionally, a significant feature adjacent to the campus is a local Eagle nest. Buffer easements have been applied to that location as well. 


Overall there is a significant amount of information in this map, but hopefully, it can all be understood. Additionally, for a look at the eagle nest itself, you can reference this link: UWF Eagle Nest

Taking the georectified imagery a step further, we wanted to add elevation data to be able to do some 3D modeling of the campus region.  Light Detection and Ranging, or LiDAR, is a way in which to generate elevation data for a particular area by using emitted radiation from a laser to catalog and organize received ranging information to generate a 3D surface based on processed ranging data. In this case, the data was supplied by the National Map Viewer and clipped to our scene area for us. With it though, I created a Digital Elevation Model, and that underlays the imagery below. The image has been rotated to provide enhanced perspective but is otherwise much the same as the above, just laid on top of a new surface which highlights the changes in elevation. 


Georectifying imagery seems to be the more common place of the two tasks. But they were absolutely extensions of each other, with multiple lessons learned. Ultimately the accuracy of the process is based off of how good the technician can enter or associate points. Though there are numerous transformation options depending on the distortion of the imagery being used. 

This was an excellent exercise, which appropriately started bogging down ArcGIS Pro from all of the layers and shifts, and display features presented. Thank you. 


v/r

Brandon

Special Topics - Mod 3 - Lab 6 - Aggregation and Scale

 Hello and Welcome back!  My how time has flown. It has almost been 8 weeks, and 6 different labs. There have been so many topics covered in...