Welcome to the culminating event of the class, the final project. This was certainly a lot of work in a short period of time. The primary subject of the final was an analysis of the Bobwhite - Manatee Transmission Line which was a Florida Power and Light initiative to bridge Manatee and Sarasota counties power needs with a new 230Kv transmission line. Before I get too indepth with the project or its deliverables, I will highlight that I have a 32 minute long presentation linked below. Additionally, the presentation and slide by slide narrative are all available right here. Then we will discuss some key areas below.
Final Project Video Presentation
Final Project Presentation PDF
Final Project Slide Commentary
The overarching purpose of this project was to perform a suitability analysis on this already complete project. It was started in 2006, and completed sometime in 2022, or so my sources show. but, using GIS principles and skills, can we validate and or recreate some of the forethought analyses that went into this project to determine if it meets the following criteria: minimal impacts on homes and homeowners, minimal school impacts, avoids negative impacts for parcel owners, and conservation areas, and is the overall line length affordable?
To answer these, several different analyses were performed. Each of which generated some map elements that feed the presentation linked above.
Lets first take a look at the base map.
The primary highlight here is that we are looking at Manatee and Sarasota Counties in Florida, and have several different looks at the Preferred Corridor outlined in red, which is within an overall project study area, the rectangle in blue.
Next let's look at each of our objective criteria: conservation lands interaction, homes, schools, parcel impacts, and then the overall length.
The key here was defining the intersection between the conservation areas and the preferred corridor. And also breaking down the whole of the corridor into wet and dry land. All of these were then taken into account as they defined the environmental impacts to this region.
Changing gears and toolsets we will look at the impacts on homes.
This process involved utilizing the reference imagery to populate a feature class shell with home locations across the preferred corridor. This map also introduces a 400-foot buffer around the preferred corridor, which was used to identify homes inside the corridor, and those still in close proximity but outside.
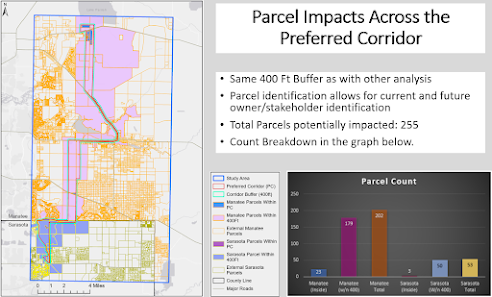
Following this I looked at parcel interactions with the preferred corridor.
This map and graphic breaks down parcels that are completely contained by the preferred corridor, and those that merely intersect it. Utilizing the select by location feature and defining that within vs connecting relationship allows us to identify all of the impacted parcels so that a more accurate list of stakeholders can be generated.
Next we had to look at school considerations.
This is my least favorite aesthetically. It is a very simplistic overview of school clusters across the counties. Only 5 of which are located within the study area, and none of which are in the preferred corridor. This would suggest there is negligible school impacts. However, despite that, this was one of the most involved processes to generate this map view.
Specifically, the school data have to be obtained from the Florida Department of Education, then converted into a useable tabular format. Separately, line information for the counties was acquired and put into an address locator. This locator when married with the tabular school data created a geocoded schools layer, which is all of the points you see here.
From there, the final look is at the length of the corridor.
This one was fairly entertaining to create. Even though its a simpler view than the above, finding ways to transform the polygon-based preferred corridor into a center line, in order to calculate the overall length was interesting. Ultimately we can see that a direct start-to-finish line only covers 18 miles, but the circuitous route that the corridor takes adds several miles. Up to approximately 25.
Taking all of the images together into account we can paint the picture that the multiple bends, offsets, and adjustments to the line is what really makes it work. While it is a longer path from start to finish this way, it very well does minimize as many impacts as possible.
For a much more thorough discussion on this process and project, please watch the presentation linked above. Thank you.
v/r
Brandon


No comments:
Post a Comment