Hello and welcome to the second module for Special Topics!
In these next two lab weeks we will be looking at Surfaces. This week specifically we are looking at actual ground surfaces through a couple of different tools. Specifically, we are using Triangular Irregular Networks and Digital Elevation Models and comparing similar continuous phenomena with them. In previous classes, we have looked more extensively at DEM's, so for now I will do a little more look at TINs. But first a quick look at what we are working with this week.
There were four different parts of this week's lab which all built on each other. Each part helped build a better understanding of 3d visualized terrain elevation information. It culminated in taking a set of points with elevation (z) information associated. The same set of points was used to create contour lines by first generating a TIN and second generating a DEM. There are a few keys to remember when working with point data like this.
There are point density considerations, particularly based on the amount of change over the study area. Dr. Morgan simply put, the more points the better (in general). Despite that, more doesn't always matter. It is more appropriate to increase your point density relative to the amount of change in your study area. Flatter areas or those with little terrain variation require fewer sample points to maintain accuracy. More variable terrain or areas with steep changes (mountains, valleys, cliffs, peaks) need a higher point density to retain accuracy. The more sample points in this case let the TIN capture more variations in elevation. Another key point is the idea of critical points. Focusing on critical points like peaks, ridges, and depressions allows a more efficient usage of points than just a consistent distribution of points.
DEM Elevation and Contour Lines:


Overlaps in the two derived contour lines:
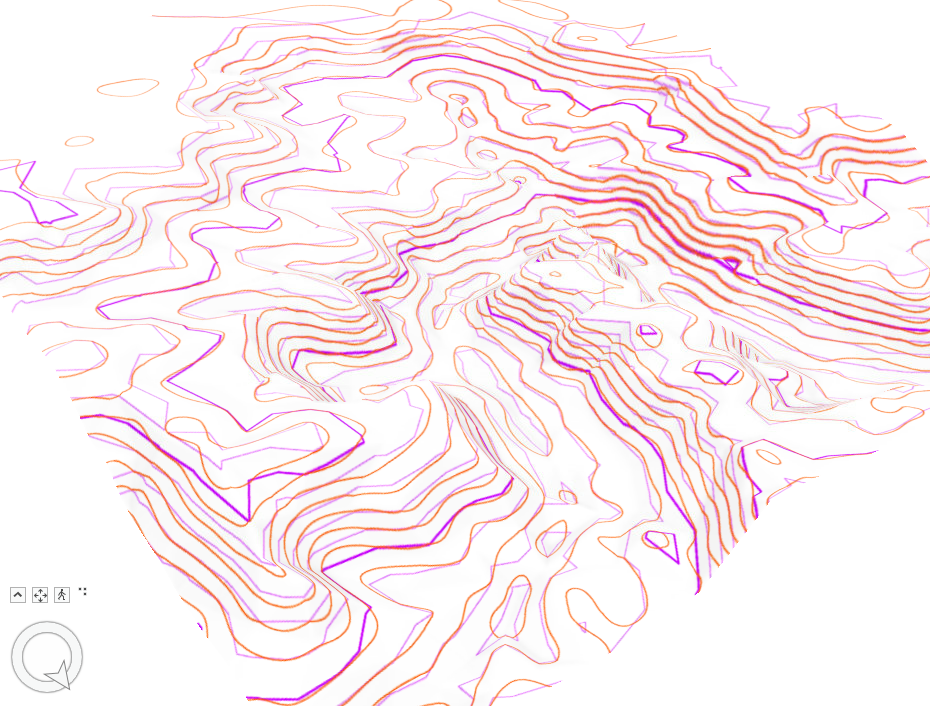
Purple / Light Purple: Index Line and Regular Contour for the TIN
Brown/Orange: DEM Contour line
The biggest difference between the two sets of contour lines
is that the DEM derived lines are much smoother. The TIN derived lines have
much more straight edges and corners for direction shifts. This makes sense,
since the TIN is as its name implies, triangular. This gives them a harder,
more angular presentation, compared with the smooth rounded DEM contours. The lines appear to be most similar, or have
limited variation in the steeper transitions. But some of the most noticeable
shape differences are on the peaks and in the valleys. But there are some
instances where it looks like some lines on the TIN jump from one layer to the
next, which is not as much the case with the DEM lines.
v/r
Brandon


No comments:
Post a Comment