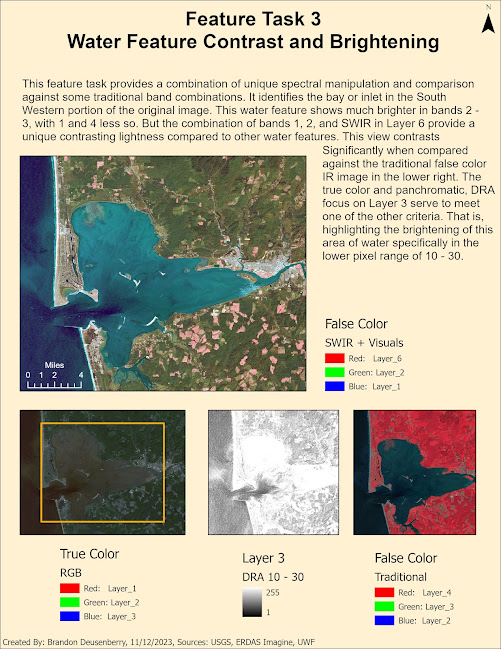
This week's topic revolved around multi-spectral analysis through spectral enhancement. This involved taking existing spectral data and presenting it in a manner that might bring out certain relationships or patterns that might not have been originally obvious. The objective was to study an image set and identify certain spectral relationships by evaluating information available across multiple bands of the same image. Manipulating the pixel values through particular enhancements, and then identifying specific values correlating to specific feature types in the image helped build confidence in both ERDAS Imagine and ArcGIS. Both tools were used to explore the given image. Several tools within ERDAS were used, such as the Inquire cursor to look at particular groups of pixels for their relevant brightness information. Histograms and contrast information were used to identify patterns within multi-spectral and panchromatic views of one or more spectral bands. Specific criteria were provided for us to evaluate the image and locate features that matched. The first criteria involved locating features that correlate to a spike in the histogram data within spectral band 4 in values between 12 and 18.
The last criteria being looked for revolves around water features that when looking at bands 1-3 become brighter than usual, but remain relatively constant in bands 5 and 6.


No comments:
Post a Comment